Findings
Networks are healthiest when the groups that comprise them are well-connected and close together enough to enable ready collaboration, support, and resource sharing, but not so tightly clustered that members’ exposure to external influences, ideas, and experiences is restricted. [11] To that end, when you look at the network visualizations (below), what do you see? Is the network interconnected enough to enable a sufficient flow of resources to yield collaborations? Is it overly homogenous, and lacking a diversity of actors that could infuse important contributions? Which sectors or topic areas of work seem underrepresented to you, and how could they be brought into the network?

[11] Giuffre, K. 2013. Communities and Networks: Using social network analysis to rethink urban and community studies. Polity Press: Malden, MA.

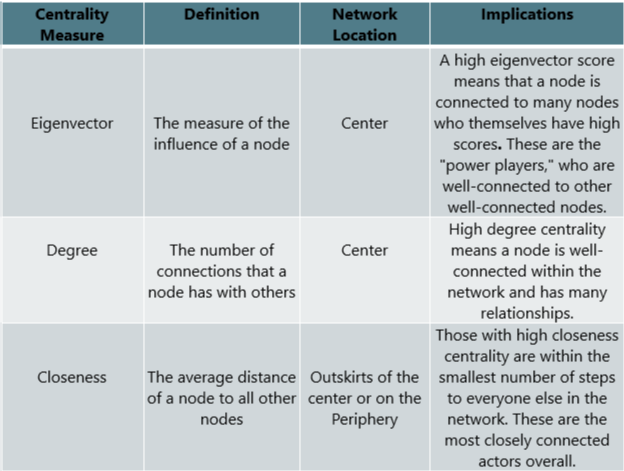
In this visualization, the larger circles that are clustered at the center of the network (inside of box and in subset on the right) indicate measures of eigenvector centrality; the greater the eigenvector centrality, the larger the circle. Here, we see which projects have high eigenvector scores, meaning that they have many ties to other people and projects which themselves have many ties to well-connected others. Note the many university (orange) and local government (lime green) affiliated people with high eigenvector scores.

Here, we see the same measure of connectedness but for people and organizations instead of people and projects. This visualization makes it clear that Colorado State University and the City of Fort Collins are important organizations in the environmental sustainability network. Also of note are the non-profit organizations that create linking relationships between those two large organizations and other members of the network.

This table shows the top organizations in terms of total number of ties to other people, projects, and organizations in the network. The frequency distribution on the right shows that the majority of members in this network have a degree centrality measure of between 0 and 6, which provides context for the top-ranked organization, Colorado State University, and its 87 ties (that’s a lot!).

Similarly, this table shows the top projects in the network in terms of number of connections to others. Notice which topic areas of work appear on this list, and which ones are missing.

This is a visual representation of the previous table, showing only the projects with the most connections to others in the environmental sustainability network.
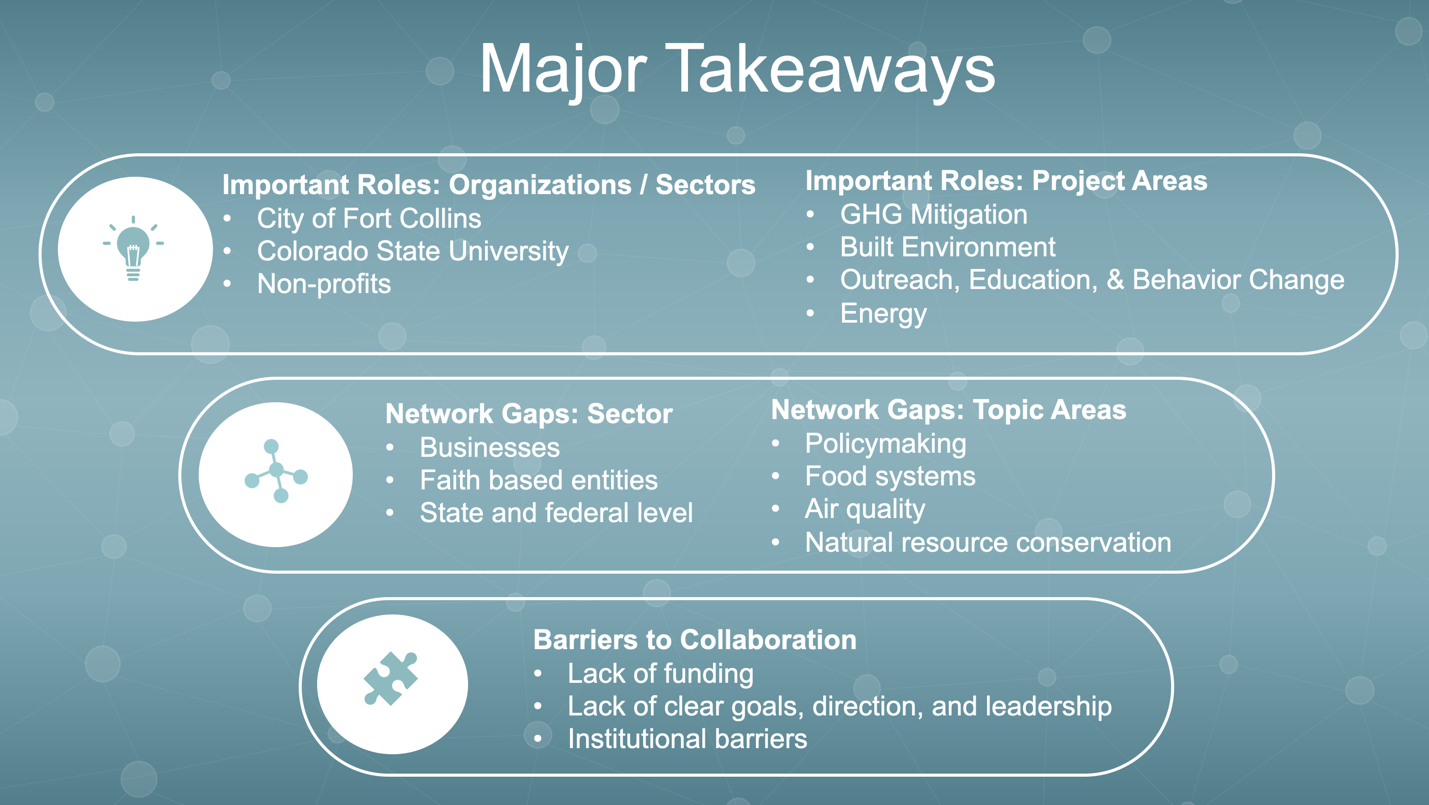
All of the network visualizations indicate the central role that Colorado State University, the City of Fort Collins, and the City’s Climate Action Plan play in terms of uniting disparate actors in collaborative efforts. These organizations and the people with high centrality measures (see below) should recognize that these leadership positions provide them with the opportunity to make a positive impact on the cohesiveness and comprehensiveness of the network.

Types of centrality measures

Descriptive statistics for network centrality measures
The network structures outlined in the various maps reveal that there are gaps along sectoral lines. The business community has few participants in the environmental sustainability network, and those few are mainly on the periphery and not well-connected. The same is true of county-, state-, and federal-level actors, organizations from faith communities, and charitable foundations. In order to infuse a diversity of expertise and resources into the network, actors and organizations from these sectors should be included in projects and other collaborative opportunities.
We are also able to see which topic areas of work tend to linger on the periphery of the network, remaining more siloed, and which topic areas tend to engage a diverse range of stakeholders by acting as collaborative hubs in the center of the network.
Less Collaborative Engagement
- Water
- Transportation
- Food Systems
- Natural Resource/Ecosystem Conservation
More Collaborative Engagement
- Greenhouse Gas Mitigation
- Waste Reduction
- Outreach, Education, and Behavior Change
- Energy